Tallyfy’s REST API gives developers full programmatic access to the same platform features that…
Sniff API calls using Chrome
Inspecting Tallyfy API calls with Chrome DevTools
Section titled “Inspecting Tallyfy API calls with Chrome DevTools”Tallyfy uses an API-first architecture, which means every action in the web app makes API calls you can inspect. By watching these calls in Chrome DevTools, you can figure out exactly how to replicate them for your own integrations.
Before you start
Section titled “Before you start”- Chrome browser (latest version recommended)
- A Tallyfy account with the right permissions
- Basic understanding of HTTP requests and JSON
Required API header
Section titled “Required API header”When making direct API calls to Tallyfy, you must always include this header:
X-Tallyfy-Client: APIClientCapturing API calls
Section titled “Capturing API calls”Setting up DevTools
Section titled “Setting up DevTools”- Sign in to Tallyfy in Chrome.
- Right-click anywhere on the page and select Inspect to open DevTools.
- Click the Network tab.
- Make sure recording is active (the red record button should be filled in).
- Check Preserve log to keep requests between page navigations.
- Check Disable cache for fresh responses.
- Clear existing entries by clicking the clear button.
- Perform the Tallyfy action you want to analyze - load a template, launch a process, complete a task, etc.
- Click the Fetch/XHR filter at the top of the Network panel.
- Type
/api/in the filter box to show only Tallyfy API calls. - Click any request in the filtered list to open its details.
Reading request details
Section titled “Reading request details”Headers tab
Section titled “Headers tab”In the Headers tab, you’ll find:
-
General info: The full request URL, HTTP method (GET, POST, PUT, DELETE), and status code (200 for success, 400 for client errors, etc.)
-
Request headers: Look for
Authorization: Bearer <token>,X-Tallyfy-Client: APIClient, andContent-Type: application/json -
Response headers: Server metadata, rate limiting info, and caching directives
Payload tab
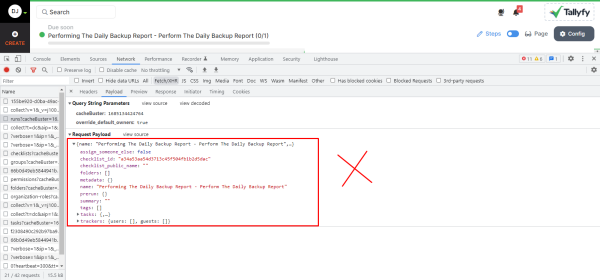
Section titled “Payload tab”For POST, PUT, or PATCH requests, click the Payload tab to see what was sent:
- Form Data shows URL-encoded parameters
- Request Payload shows the JSON body
- View Source shows the raw data exactly as sent
To copy the payload:
- Click the view source subtab.
- Select all the text in the payload area.
- Copy it - you can use this exact format in your own API calls.
Response tab
Section titled “Response tab”Check what came back from the server:
- The Response tab shows raw data
- The Preview tab shows formatted JSON
Look at the data structure, success/error messages, pagination info, and timestamp formats.
Required headers for replicating calls
Section titled “Required headers for replicating calls”| Header | Value | Purpose |
|---|---|---|
Authorization | Bearer YOUR_TOKEN | Authentication |
X-Tallyfy-Client | APIClient | Required identifier |
Content-Type | application/json | Request format |
Accept | application/json | Response format |
Testing your captured calls
Section titled “Testing your captured calls”To verify you’ve correctly captured a Tallyfy API call:
- Copy the endpoint URL, headers, and payload from DevTools.
- Recreate the request using Postman, Insomnia, or cURL.
- Compare your response with what you saw in DevTools.
- Troubleshoot any differences.
Example cURL command
Section titled “Example cURL command”Here’s what a typical Tallyfy API call looks like in cURL - this one launches a process from a template:
curl -X POST "https://go.tallyfy.com/api/organizations/{org_id}/runs" \ -H "Authorization: Bearer YOUR_TOKEN" \ -H "Content-Type: application/json" \ -H "X-Tallyfy-Client: APIClient" \ -H "Accept: application/json" \ -d '{ "checklist_id": "abc123", "name": "Test Process" }'Useful DevTools features
Section titled “Useful DevTools features”Exporting a request as cURL
Section titled “Exporting a request as cURL”- Right-click on any API request in the Network panel.
- Select Copy > Copy as cURL.
- Paste it into a terminal or text file - it’ll include all headers and auth tokens automatically.
Throttling network speed
Section titled “Throttling network speed”You can simulate slow connections to test how your integration handles latency. Click the dropdown next to Online in the Network panel and pick a throttling preset.
Troubleshooting
Section titled “Troubleshooting”No requests showing up
Section titled “No requests showing up”- Make sure DevTools is open before you perform the action
- Enable Preserve log in the Network tab
- Disable cache and hard-refresh the page
- Check you’re looking at the correct browser tab
Filter isn’t showing results
Section titled “Filter isn’t showing results”- Verify the filter text matches part of the API URL
- Try clicking Fetch/XHR instead of using the text filter
- Clear all filters to confirm requests exist at all
Getting 401 authentication errors
Section titled “Getting 401 authentication errors”- Check that your Tallyfy session is still active
- Verify the Bearer token hasn’t expired
- Make sure all required headers are included
- Confirm your account has permission for the action
CORS or preflight issues
Section titled “CORS or preflight issues”If you’re making cross-origin requests from your own app:
- Watch for
OPTIONSpreflight requests in DevTools - Check the response headers for allowed origins and methods
Security reminders
Section titled “Security reminders”- Never share your auth tokens publicly or in screenshots
- Mask sensitive data before sharing request details
- Tallyfy logs all API actions in its audit trail
Related articles
Section titled “Related articles”Open Api > API integration guide
Tallyfy’s REST API lets you connect workflow features to external systems using OAuth 2.0…
Api Clients > Getting started with Postman API testing
Test Tallyfy’s REST API in Postman without writing code. Authenticate with the password grant…
Code Samples > Authentication methods
Tallyfy API authentication uses either a personal access token (lasting 6 months from Settings)…
About Tallyfy