Top 11 Six Sigma tools for effective change management
Eleven Six Sigma tools that actually matter for process improvement - from control charts that catch variation early to FMEA for preventing problems and process stapling for seeing how work really happens.
Six Sigma tools require structured processes for measurement and improvement.
Tallyfy is Process Improvement Made Easy
Summary
- Control charts catch variation before it becomes a problem - Deming was right: uncontrolled variation kills quality. Control charts plot measurements over time with upper and lower limits, helping you distinguish between normal noise and real signals that something changed
- FMEA prevents problems instead of fixing them - Failure Mode Effects Analysis asks “what could go wrong?” systematically, scoring each potential failure by severity, likelihood, and detectability to prioritize prevention efforts
- Process stapling reveals what actually happens - Following a document or request through every real step exposes the workarounds, delays, and handoffs that never make it into formal process documentation
- Value stream mapping and fishbone diagrams find root causes - These classic tools visualize where time gets wasted and brainstorm what’s causing problems at a deeper level. Need help improving processes?
Quality and compliance come up in over 1,500 combined discussions we track with mid-market teams. Six Sigma tools are an essential part of any business process improvement initiative. By identifying flaws and weaknesses in your processes, they allow you to significantly improve the efficiency of your business.
Six Sigma tools to help drive change
Six Sigma is a methodology that helps eliminate waste & inefficiencies within business processes. Six Sigma tools, on the other hand, are techniques and methodologies that help with the analysis and improvement of the said processes. If used the right way, Six Sigma tools can help eliminate waste, increase employee productivity, and drive profits. Here are 8 of the most important Six Sigma tools that you can begin incorporating into your organization.
Value-stream mapping
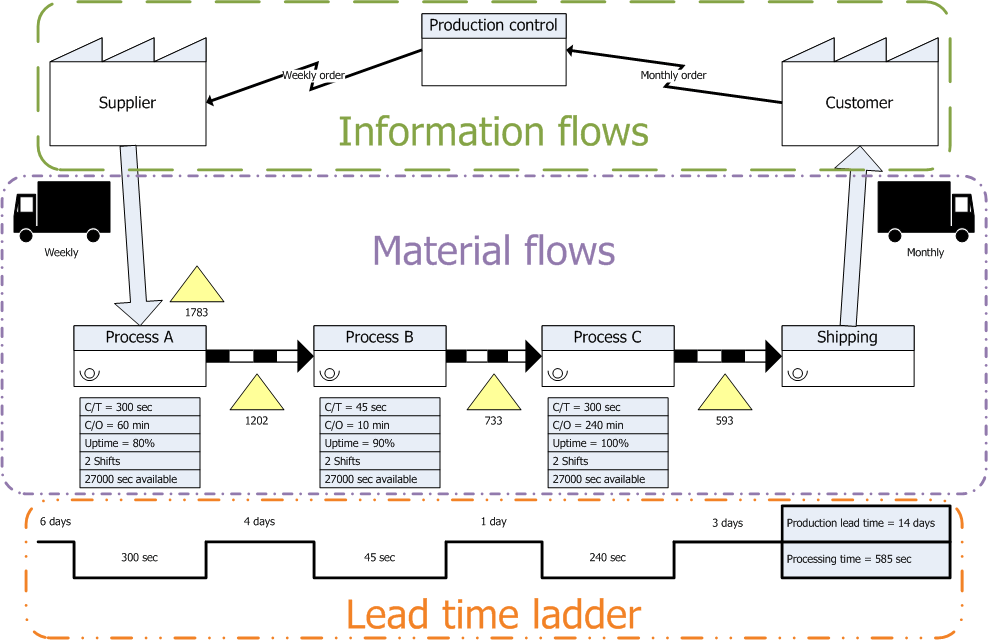 The value-stream map outlines the information and materials required to bring the product to a customer. This tool is helpful for streamlining the production process.
Although value-stream mapping is primarily used in lean manufacturing, it can be useful for businesses in almost any industry. Its main goal is to visualize such information as time period, error rate, and unnecessary delays within the process. Value-stream map consists of three different parts: the process map, the timeline, and the information flow.
It uses a unique set of symbols to help you better understand the process. The process map includes each of the steps involved in the business process.
The timeline comes from the process map and summarizes all the data on duration of the process. The information flow explains how each of these steps interacts with each other.
Cause-and-effect analysis
A cause-and-effect analysis diagram is also called fishbone diagram because it resembles a skeleton of a fish. It is one of the most famous Six Sigma tools, as it allows you to brainstorm various causes of a problem.
The first step in performing the analysis is to identify the problem you want to solve. You have to write down who works on the process and when and where the process occurs. Next step is to write the problem in a box on the left-hand side of the paper.
Then you draw a horizontal line extending to the other end of the paper. From there, you draw vertical lines extending off of the “spine”.
On these lines, you write the major reasons behind the problem and think through any possible causes. You can further break these causes down into sub-causes. Once you complete the diagram with all possible causes of the problem, you can analyze your results.
The results may need further testing and analysis.
The 5 whys
Organizations often find that one and the same problem occurs over and over again. No matter how many times they address it, it keeps creeping back in at a later date.
Problems that won’t go away are the symptom of a deeper issue that you need to resolve. To get to the root of chronic issues, you can use the tool known as the 5 whys. The 5 whys originated in the 1930s with the Japanese industrial revolution. The method is simple: when the problem arises again, you get to the cause by asking “why” five times.
This method is most effective when used to deal with moderately difficult problems. If you deal with more complex issues, you may achieve better results by using a cause-and-effect diagram.
The 5 whys sounds like a very unsophisticated method, but don’t underestimate it. Its simplicity is what makes it so helpful. Besides, this tool works well in combination with other Six Sigma tools.
Kanban system
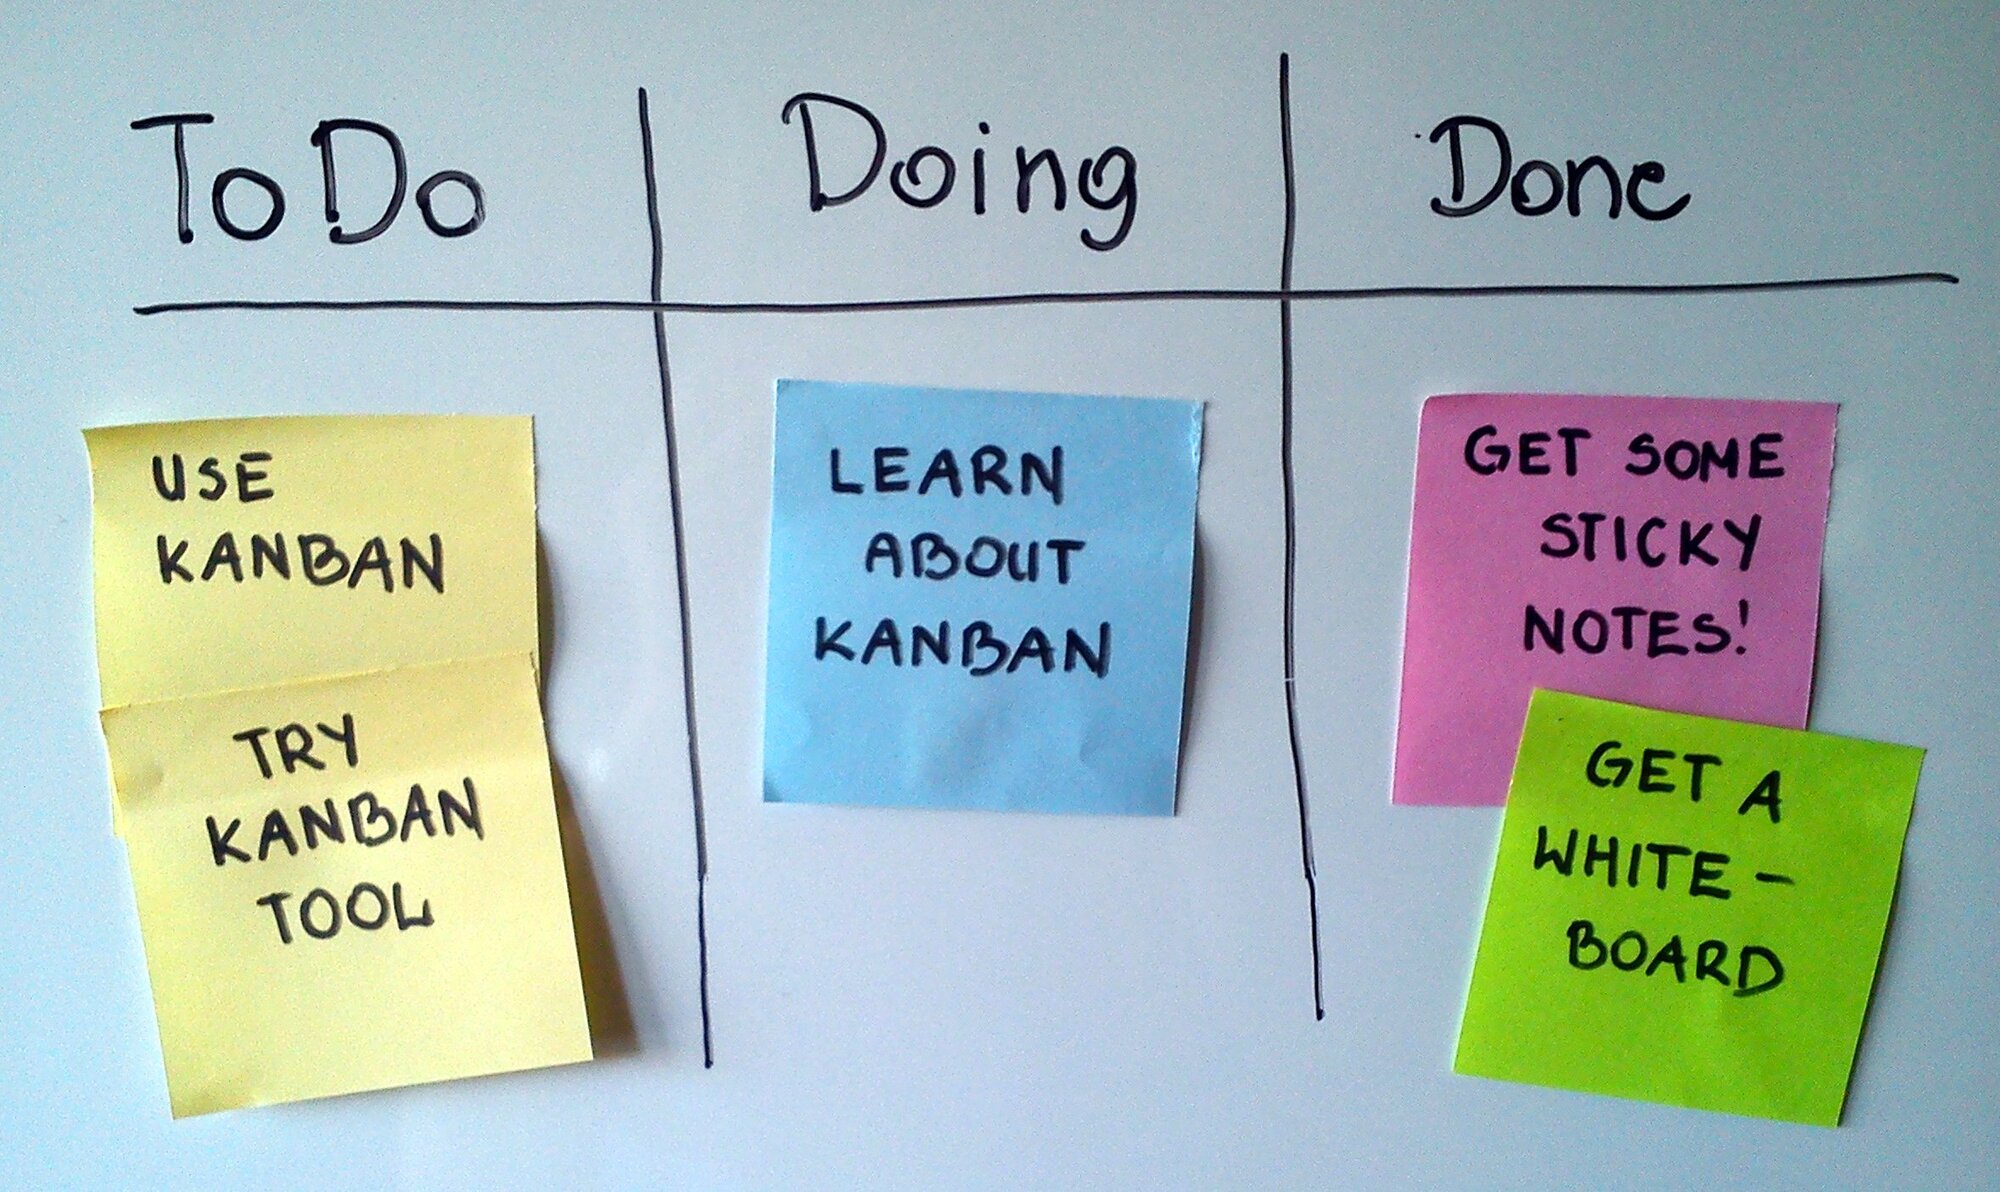 Kanban System is a supply chain control system that focuses on cost reduction by implementing just-in-time inventory control system. It is also one of the most popular Six Sigma tools, due to its ease of use and potential benefits.
“Kanban” is Japanese for “billboard.” The term was coined by Taichi Ohno, an industrial engineer at Toyota. Ohno based his system on how supermarkets control their inventory depending on the demand. When you shop at a supermarket, you don’t stock up for month or years ahead.
Neither does the store stock items that it doesn’t expect to sell right now. Instead, you tailor your shopping list to what you need right now, just like the store bases its supply of the products on customer demand.
Kanban mimics this arrangement by allowing the demand for the firm’s output to control the supply of its inventory. Kanban system sets limits for the inventory-holding for all current business processes. This frees additional resources and allows to use them better.
Kanban system works on a simple and elegant idea: only activate the supply chain when the demand requires it. This system both brings more focus to the business process itself and increases its efficiency.
Control charts and process variation
Here’s something Deming drilled into quality circles decades ago: uncontrolled variation is the enemy of quality. He wasn’t being dramatic. Most process failures aren’t caused by some big obvious disaster - they’re caused by small variations that creep in over time until suddenly you’re producing garbage and nobody can pinpoint when it started.
Control charts solve this by giving you a visual heartbeat of your process. You plot your measurements over time with upper and lower control limits. When data points stay between those lines, your process is stable. When they start wandering outside or showing weird patterns - trending upward, clustering, anything non-random - something’s changed. The process is telling you to pay attention before it becomes a real problem.
The tricky part? Not every variation needs fixing. Control charts help you distinguish between “common cause” variation (the normal noise in any system) and “special cause” variation (something actually went wrong). Chasing common cause variation is a waste of time. Ignoring special cause variation is how small problems become expensive disasters.
Pareto chart
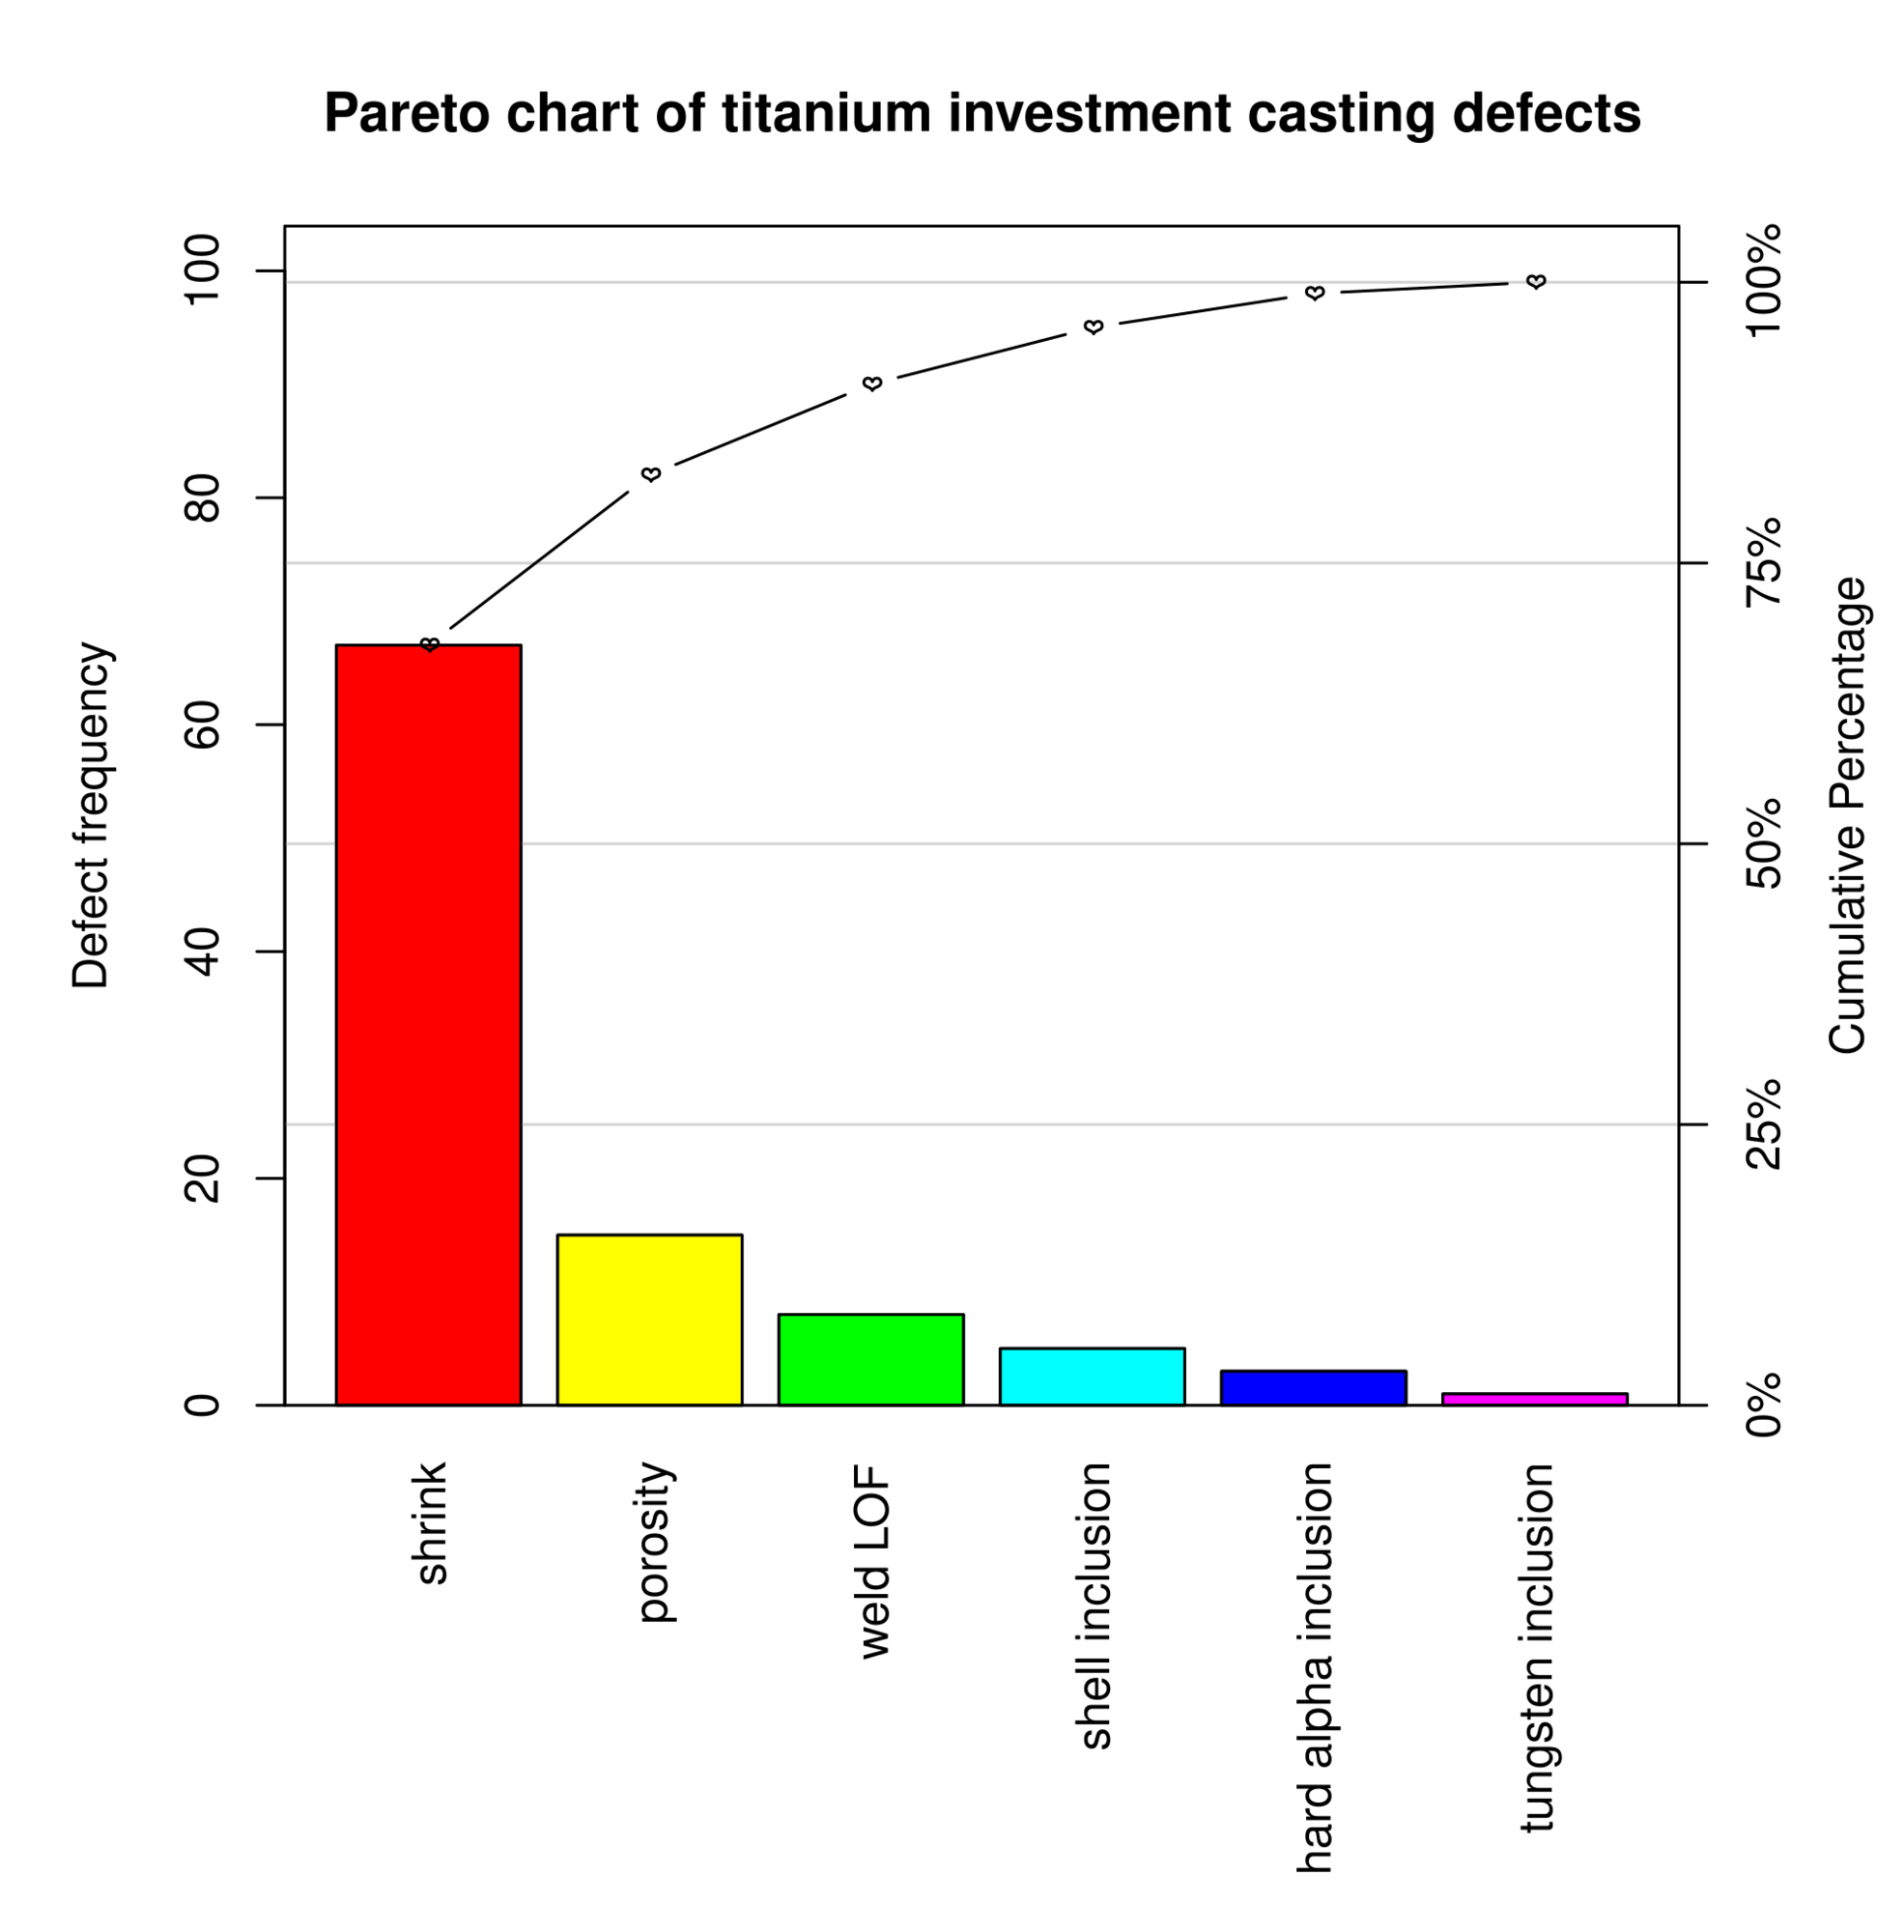 Pareto Chart is a graphic representation of the Pareto Principle: 20 percent of input produces 80 percent of output in any given situation. The chart combines a vertical bar graph and a line graph.
The bar graph represents the metrics of various business process components, ordered from the largest to the smallest one. The line graph represents the cumulative total of these metrics. Pareto Chart is a tool that visualizes what part of the process influences output the most.
To create such chart, you first figure out the components of the process and how to measure them. Once you’ve done that, you can put this data into a Pareto Chart.
This will help you see how big of an influence on the outcome each component has. In addition to that, it will give you a clear idea of what requires your immediate attention.
FMEA - prevention over firefighting
Most Six Sigma tools help you fix problems. FMEA - Failure Mode Effects Analysis - helps you prevent them before they happen. It’s basically asking “what could possibly go wrong?” in a structured way.
Here’s how it works. You list every step in your process, then brainstorm what could fail at each step. For each potential failure, you score three things: how severe would the impact be, how likely is it to happen, and how detectable is it before causing harm? Multiply those three scores together and you get a risk priority number. High numbers get attention first.
The detection part trips people up. A failure mode that’s extremely likely but also extremely obvious might be less risky than something rare but invisible until it’s too late. FMEA forces you to think about this. At Tallyfy, we’ve heard the same frustration from operations teams - they spend all their time putting out fires instead of preventing them. FMEA shifts that balance. It’s not glamorous work, but neither is explaining to your boss why the same problem keeps happening.
Process mapping
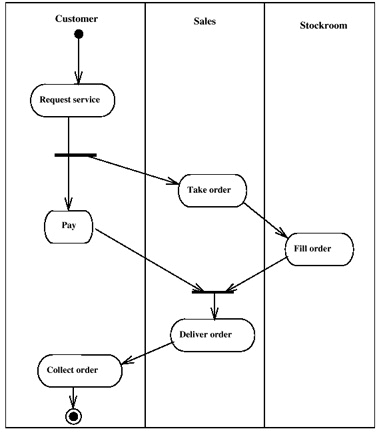 Business process mapping is a way to visualize the business process and better understand how it works. A typical map outlines the roles, responsibilities, and standards involved in the process.
It presents this data in a structured way that shows the steps of the process along with who is responsible, what the inputs and outputs are, and other information relevant to the process.
Visualization matters. In my experience, business process mapping is probably one of the best aids in problem-solving. It visualizes the entire process, making it easier to see what is wrong and get straight to the root cause. It also helps to visualize the roles of the people within the process and ensure everyone knows what to do.
In our conversations, we have heard from healthcare organizations managing 40,000+ users and 87,000 documents that process visibility is the single biggest pain point. Without clear maps showing who approves what and when, policy compliance becomes guesswork rather than a systematic control.
In addition to that, business process mapping is great for finding the potential risks the process creates. Constructing a map makes you rethink each step of the process and see if there are any liabilities hidden within.
Types of process maps
Whether you use business process mapping to see the big picture or to concentrate on the details, you can choose a map that works best for your goal.
- Flowchart is the most common type of a process map. While this process map is less flexible, you can easily draw it by hand or in software like MS Office. Flowcharts are often used for the creation of workflow diagrams.
- Swimlane diagram is similar to generic flowcharts, except it is better structured in terms of which job title does which task.
- Value stream map is a more in-depth alternative to the flowchart. It is common for lean Six Sigma operations, and you may find it harder to analyze at a glance.
- SIPOC Diagram (Supplier Inputs Processes Outputs Customer) is the most visually simplified map. It focuses on the essentials of the process and the people involved. By stripping all extra information, it defines a complex project better in terms of its basic elements.
Project charter
Project Charter is a document that defines the purpose and the scope of the project. It works both as the template for the business process and as legal authorization of the project.
Project charter usually includes the project overview and its scope, details about the team and the resources, and the timeline. It gives you all the basic information about the project and clarifies the main points about it. The main benefit of a project charter is that it keeps things less chaotic.
Once a team dives into the project, it is easy to lose track of who is responsible for what, which deadlines the team has to meet first, etc. If the company doesn’t have a clear managerial hierarchy, things will get even messier.
Having a project charter helps you to keep a clear focus on what your project is all about. It lets you understand the project’s structure and the relationship between the people involved. In other words, project charter helps you bring your firm back to order when things get confusing.
RACI matrix
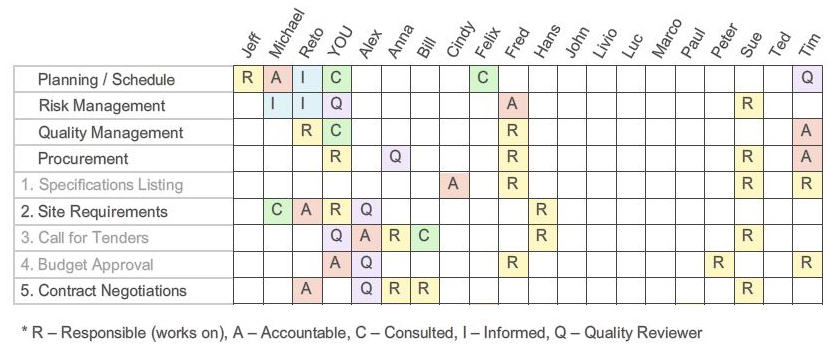 Responsibility Assignment Matrix, also known as RACI matrix, is a table that describes the responsibilities of each team member on every task of the business process. RACI stands for Responsible, Accountable, Consulted, and Informed - the key responsibilities most commonly used in the matrix.
Responsible refers to those whose role is to achieve the task. Accountable is the person assigning the tasks to others and monitoring their progress. There is always only one accountable per task.
Consulted are the experts on the subject matter whose opinions guide those working on the task. Finally, informed are the people you notify once you complete the task.
Typically, RACI matrix has the tasks specified on the left of the table and the team members listed in the top row. The cells at the intersection of the two have the letter corresponding to what the person handles within the task. This simple system helps every team member clearly understand their role in the process.
It also allows you to see the gaps in the team structure and which roles you have to fill.
Process stapling - see the work as it really happens
All these tools share a weakness: they work on your description of the process, not the process itself. And descriptions lie. Not on purpose, but because the person writing them down isn’t the person doing the work eight hours a day.
Process stapling fixes this. The concept is simple - you metaphorically “staple yourself” to a document, request, or piece of work and follow it through every step. You watch where it sits waiting. You see who handles it and what they actually do. You notice the workarounds and shortcuts nobody documented because “that’s just how we do it.”
It sounds obvious, but I’m consistently surprised how rarely it happens. Teams will spend weeks mapping processes in conference rooms when they could learn more by spending a day following the work. The formal process says approval takes two steps. The stapled observation reveals it bounces between three inboxes because someone’s always on PTO. That’s the kind of insight that turns a mediocre improvement into a meaningful one.
Are you using the right tools?
Are you hearing this at work? That's busywork
Enter between 1 and 150,000
Enter between 0.5 and 40
Enter between $10 and $1,000
Based on $30/hr x 4 hrs/wk
Your loss and waste is:
every week
What you are losing
Cash burned on busywork
per week in wasted wages
What you could have gained
160 extra hours could create:
per week in real and compounding value
Total cumulative impact over time (real cost + missed opportunities)
You are bleeding cash, annoying every employee and killing dreams.
It's a no-brainer
Put Six Sigma principles into practice
These templates help you implement quality control workflows with built-in inspection checkpoints, root cause tracking, and standardized processes.
Related questions
What are Six Sigma tools?
Six Sigma tools are a mix of problem-solving methods, used to help improve business processes. Such solutions can enable companies to avoid costly errors, minimize expenses, and improve customer satisfaction. Common Six Sigma tools are process maps, cause-and-effect diagrams, and control charts. So imagine them as a kind of Swiss Army knife of business improvement - and each tool has a purpose and is designed to deal with different aspects of a problem.
What are the 6 parts of Six Sigma?
The six components of Six Sigma are in fact the steps of the DMAIC process: Define, Measure, Analyse, Improve, Control. Wait, that is only five?
You are right! The people are considered to be that sixth element - they include the team members and the leaders to lead the improvement forward. This human aspect is essential, because all the best tools are useless if not employed by skilled hands.
What are the Six Sigma steps?
The Six Sigma steps are derived from the acronym DMAIC: Define the problem, Measure current performance, Analyze root causes, Improve the process, and Control the new solution. It is almost like a recipe for success - Each stage of the journey is just adding on that little bit more to the stage before and taking you from recognising a problem to implementing and then sustaining a solution. This disciplined process keeps teams on target with tangible results.
When to use Six Sigma tools?
Any time you are looking to solve a tough problem or improve business performance you can turn to these Six Sigma tools. And they can be particularly helpful when you are addressing a known issue, a complaint from a customer, or when you are trying to achieve close-to-perfect quality. So think of yourself as a detective solving a case and the Six Sigma methods as your magnifying glass and fingerprint kit helping you find clues and put together answers in the business world.
What are Six Sigma QC tools?
Six Sigma QC Tools The Six Sigma field quality control (QC) tools are certain techniques used to monitor quality and to improve product or service quality. These “7 QC Tools” are: 1) Pareto charts 2) cause-and-effect diagrams 3) check sheets 4) control charts 5) histograms 6) scatter diagrams 7) stratification. Consider them your quality superheroes - each has a superpower to battle against defects and variability present in your processes.
How to pick the right Six Sigma tools?
Selecting the appropriate Six Sigma Tools is just like choosing the right outfit - it depends on the occasion and what exactly you need. Begin by articulating your problem or objective in simple terms.
Then think about what your data is, and where you are at in your project. For instance, a fishbone diagram is helpful for brainstorming causes, while a control chart is valuable for evaluating ongoing performance. Don’t be shy about throwing tools together - many of the most successful Six Sigma practitioners use more than one tool at a time to address thorny problems.
About the Author
Amit is the CEO of Tallyfy. He is a workflow expert and specializes in process automation and the next generation of business process management in the post-flowchart age. He has decades of consulting experience in task and workflow automation, continuous improvement (all the flavors) and AI-driven workflows for small and large companies. Amit did a Computer Science degree at the University of Bath and moved from the UK to St. Louis, MO in 2014. He loves watching American robins and their nesting behaviors!
Follow Amit on his website, LinkedIn, Facebook, Reddit, X (Twitter) or YouTube.

Automate your workflows with Tallyfy
Stop chasing status updates. Track and automate your processes in one place.